Appreciate the Past to Predict the Future - Data Storage Milestones
A journey of a thousand miles begins with a single step - always. The same…
Read More#1 Software for Data Storage, Backup & Business Continuity
Very often, storage product users do not know what kind of performance numbers to expect in real operations. Why do storage vendors claim such great performance when measured by an industry accepted reference tool like IOmeter, but in production database applications are often very slow?
The biggest difference comes from how the data is being read from the disk. Is it in sequential blocks or is it scattered in random blocks all over the drive? How big of a difference does a sequential data pattern vs. a random data pattern make? This may be obvious for experienced users but we receive a lot of questions about it; so a short and easy to follow example is in order.
To show examples of best and worst performance results with IOmeter, we can use a local RAID5 controller with 3 hard disks. When running RAID5 with only 3 hard disks we do not expect to see great performance numbers, but it will be enough to show the difference elicited by using different test patterns.
Test Pattern | Transfer Request Size | Percent Sequential | Percent Random | Percent Write | Percent Read | MB / second | IO / second |
1 | 2KB | 100 | 0 | 100 | 0 | 24,75 | 12674 |
2 | 2KB | 100 | 0 | 0 | 100 | 52,17 | 26708 |
3 | 2KB | 0 | 100 | 33 | 67 | 0,75 | 383 |
4 | 64KB | 100 | 0 | 0 | 100 | 103,82 | 1661 |
5 | 64KB | 100 | 0 | 100 | 0 | 94,06 | 1504 |
6 | 256KB | 100 | 0 | 0 | 100 | 141,68 | 566 |
7 | 256KB | 100 | 0 | 100 | 0 | 100,65 | 402 |
When you the read the marketing material about this particular server hardware you will find the claim that it provides over 25,000 I/O per second and over 140MB/second. These are very nice figures. But imagine you are going to index a database (similar to test case #3). Your server will actually perform at about 400 I/O per second and below 1 MB/second. Test case #3 uses the default IOmeter test pattern: 100% Random, 2kB Block Size, 33% writes and 67% reads. This test pattern shows very poor results.
Believe me, I have seen plenty of very disappointed users running the default test pattern on IOmeter. I recall an incident at the CEBIT show few years ago when a RAID controller vendor engineer was preparing their demo and noticed that one IOmeter ‘worker’ was running the default pattern; instead of the desired 400MB/sec., it was showing only about 4MB/sec. This is 100 times slower!
Let’s check the ratios between the best and worst results in our test case above.
IO / second:best / worst26708/ 383=70 |
MB / second: best / worst141,68 / 0,75 =189 |
So in the worst case we see a result 189 times slower than the marketing material claims.
What is the problem? Why does the default IOmeter test pattern show such poor results?
The main reason comes from the behavior of hard disk drives. The time to retrieve data with a random seek is much longer than with a sector to sector seek. Also the block size has huge influence on the performance results. In the worst-case combination of big/small block size and sequential/random seek results vary by over a factor of 100.
How can we improve the performance of an application?
First the application needs to be designed to move bigger blocks of data a time. Second you need disks with better average access time. SATA disks mostly spin with 7200rpm. So 10,000 rpm or 15,000 rpm disks will help significantly with a random pattern.
But recently more and more users are deploying SSD’s to improve performance with a random access pattern. We have tested 200GB Anobit SSD. (www.anobit.com) The SSD was installed in a DSS V6 server and configured as an iSCSI target. The storage client was Windows 2008 with iSCSI Software Initiator.
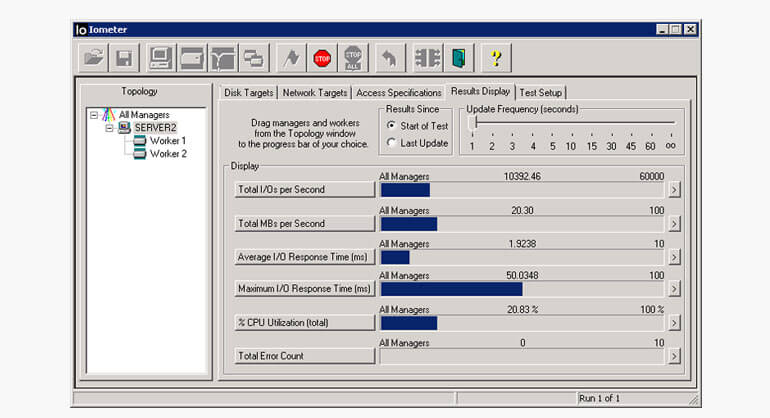
Running the default test pattern on 2 workers in IOmeter we obtained the following results:
IO / sec | MB / sec | |
SSD powered iSCSI | 10392 | 20.30 |
Local RAID5 | 383 | 0.75 |
So it looks like the single SSD powered iSCSI target was 27 times faster than the local Windows 2008 RAID5 while running the IOmeter default test pattern. The IOmeter default pattern is a good test if we are running an application such as database indexing. The SSD powered iSCSI target was 27 times better because the SSD drive has extremely good IOPS compared to SATA hard disks. But if you run any sequential pattern the results are comparable. Here are IOmeter screenshots from the default test pattern on SSD powered iSCSI Target vs. local hard disks powered with RAID5.


These are some very interesting results. Not what you would necessarily expect.
So as you can see many factors influence overall storage performance. And understanding how performance numbers are produced can give big insight into their validity. Careful use of performance measurement tools can give you useful results. It is always a good idea to understand how your storage clients will access their data on your servers.
| Test Pattern | Transfer Request Size | Percent Sequential | Percent Random | Percent Write | Percent Read | MB / second | IO / second |
| 1 | 2KB | 100 | 0 | 100 | 0 | 24,75 | 12674 |
| 2 | 2KB | 100 | 0 | 0 | 100 | 52,17 | 26708 |
| 3 | 2KB | 0 | 100 | 33 | 67 | 0,75 | 383 |
| 4 | 64KB | 100 | 0 | 0 | 100 | 103,82 | 1661 |
| 5 | 64KB | 100 | 0 | 100 | 0 | 94,06 | 1504 |
| 6 | 256KB | 100 | 0 | 0 | 100 | 141,68 | 566 |
| 7 | 256KB | 100 | 0 | 100 | 0 | 100,65 | 402 |


 Best Data Storage Solutions for Media and Entertainment Industry Purposes
 Case Study: Virtualization and High Availability in drinking water management with Open-E DSS V7
 How to monitor your Open-E DSS V7
 The Differences Between Commercial and Open-Source Products
 All hands on deck! Open-E needs your nominations
 Top 7 Protection Features for Data Storage
Leave a Reply